Tradinglite Overview
- What is Tradinglite?
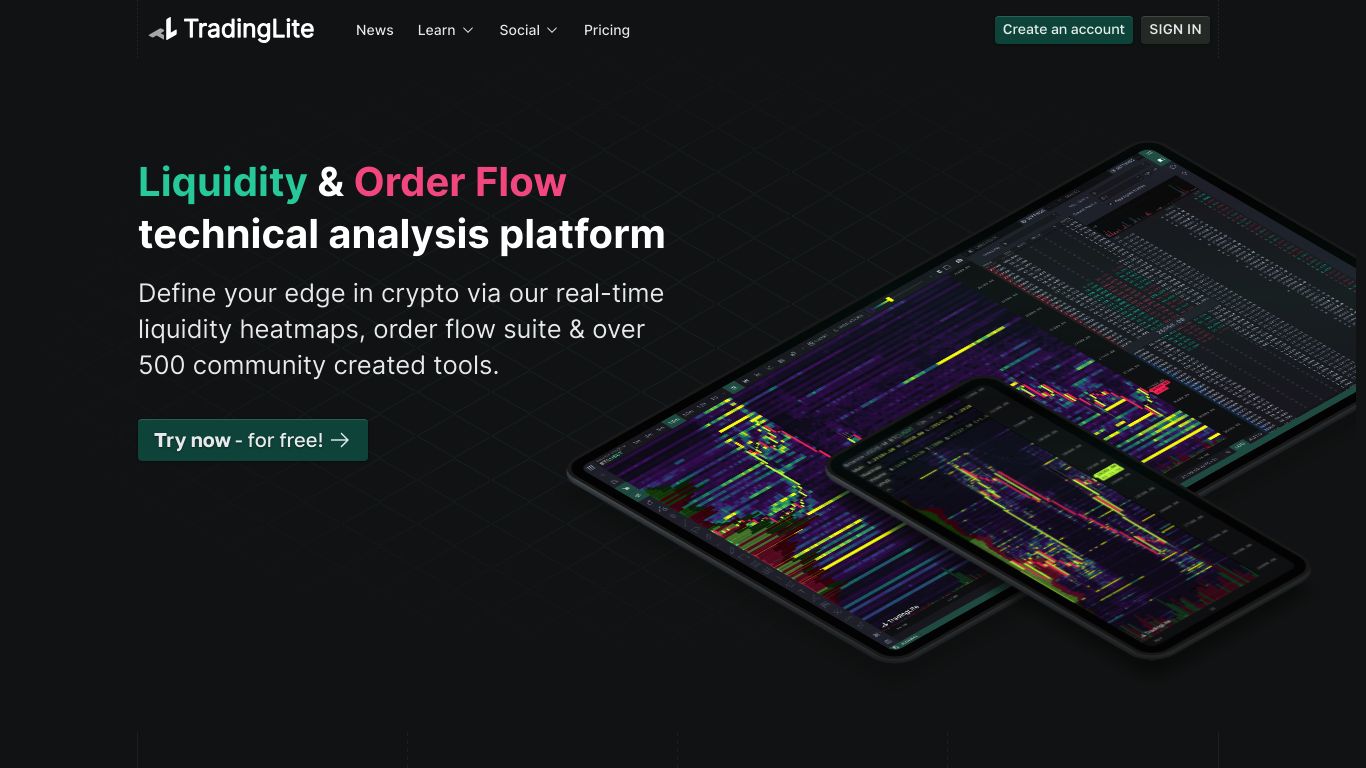
TradingLite is a technical analysis platform tailored for cryptocurrency markets, featuring advanced visualization tools to help traders make decisions. It provides real-time liquidity maps, critical data access across exchanges, and in-built indicators for simplified price information and trend discovery.
- Main Features
- Real-time liquidity heatmapsGranular order book detailAnalyze market buys and sells visuallyUltra-fast renderingPacked with advanced built-in indicators
Related Apps
Frequently asked questions
To identify key areas of interest within the market using TradingLite, you can utilize the real-time liquidity heatmap feature. The heatmap provides X-ray-like vision and includes tools for unique analysis.
TradingLite provides real-time data on multiple concurrent Order Books and Trade Feeds.
Yes, TradingLite offers a learning center. The learning center provides tutorials and guides on various topics such as chart settings, indicators, toolbar navigation, and official indicators.
User Reviews
Explore Top Apps
If you enjoy using Tradinglite, you’ll love those Web3 Analytics apps.
Stay ahead in Web3!
The latest Ethereum and L2s apps, tools and resources, sent to your inbox.